Here is a handy script that I often use to check the quality of the Zoom connection. It measures TCP latency instead of the usual ICMP stuff (which is often blocked).
#!/usr/bin/env python3
"""
TCP Ping Test (defaults to port 80, 10000 packets)

Usage: ./tcpping.py host [port] [maxCount]
- Ctrl-C Exits with Results
"""

"""
pip3 install matplotlib numpy

python3 ./tcp_ping_grapher.py 115.114.56.202 443 100
"""

import sys
import socket
import time
import signal
from timeit import default_timer as timer

# https://matplotlib.org/examples/animation/animate_decay.html
import numpy as np
import matplotlib.pyplot as plt
import matplotlib.animation as animation

host = None
port = 80

# Default to 10000 connections max
maxCount = 10000

## Inputs

# Required Host
try:
    host = sys.argv[1]
    # host = "115.114.56.202"
except IndexError:
    print("Usage: tcpping.py host [port] [maxCount]")
    sys.exit(1)

# Optional Port
try:
    port = int(sys.argv[2])
    # port = 443
except ValueError:
    print("Error: Port Must be Integer:", sys.argv[2])
    sys.exit(1)
except IndexError:
    pass

# Optional maxCount
try:
    maxCount = int(sys.argv[3])
except ValueError:
    print("Error: Max Count Value Must be Integer", sys.argv[3])
    sys.exit(1)
except IndexError:
    pass

# Pass/Fail counters
passed = 0
failed = 0

def getResults():
    """ Summarize Results """

    lRate = 0
    if failed != 0:
        lRate = failed / (count) * 100
        lRate = "%.2f" % lRate

    print("\nTCP Ping Results: Connections (Total/Pass/Fail): [{:}/{:}/{:}] (Failed: {:}%)".format((count), passed, failed, str(lRate)))

def signal_handler(signal, frame):
    """ Catch Ctrl-C and Exit """
    getResults()
    sys.exit(0)

# Register SIGINT Handler
signal.signal(signal.SIGINT, signal_handler)

def work(t=0):
    passed = 0
    failed = 0
    count = 0
    maxCount = 3200
    # Loop while less than max count or until Ctrl-C caught
    while count < maxCount:
        # Increment Counter
        count += 1
        success = False
        # New Socket
        s = socket.socket(
        socket.AF_INET, socket.SOCK_STREAM)

        # 1sec Timeout
        s.settimeout(1)

        # Start a timer
        s_start = timer()

        # Try to Connect
        try:
            s.connect((host, int(port)))
            s.shutdown(socket.SHUT_RD)
            success = True

        # Connection Timed Out
        except socket.timeout:
            print("Connection timed out!")
            failed += 1
        except OSError as e:
            print("OS Error:", e)
            failed += 1

        # Stop Timer
        s_stop = timer()
        s_runtime = "%.2f" % (1000 * (s_stop - s_start))

        if success:
            print("Connected to %s[%s]: tcp_seq=%s time=%s ms" % (host, port, (count-1), s_runtime))
            passed += 1

        # Sleep for 1sec
        if count < maxCount:
            # time.sleep(0.5)
            # time.sleep(1)
            time.sleep(2)

        t += 2
        yield t, float(s_runtime)


# Output Results if maxCount reached
# getResults()
def data_gen(t=0):
    cnt = 0
    while cnt < 1000:
        cnt += 1
        t += 0.1
        yield t, np.sin(2*np.pi*t) * np.exp(-t/10.)


def init():
    ax.set_ylim(0, 128 * 3)
    ax.set_xlim(0, 300)
    del xdata[:]
    del ydata[:]
    line.set_data(xdata, ydata)
    return line,

fig, ax = plt.subplots()
line, = ax.plot([], [], lw=2)
ax.grid()
xdata, ydata = [], []


def run(data):
    # update the data
    t, y = data
    xdata.append(t)
    ydata.append(y)
    xmin, xmax = ax.get_xlim()

    if t >= xmax:
        ax.set_xlim(xmin, 2*xmax)
        ax.figure.canvas.draw()
    line.set_data(xdata, ydata)

    return line,

ani = animation.FuncAnimation(fig, run, work, blit=False, interval=10,
                              repeat=False, init_func=init)
plt.show()
Usage:
% python3 ./tcp_ping_grapher.py 115.114.56.202 443 100
Connected to 115.114.56.202[443]: tcp_seq=0 time=10.68 ms
Connected to 115.114.56.202[443]: tcp_seq=1 time=12.02 ms
Connected to 115.114.56.202[443]: tcp_seq=2 time=13.15 ms
Connected to 115.114.56.202[443]: tcp_seq=3 time=10.71 ms
...
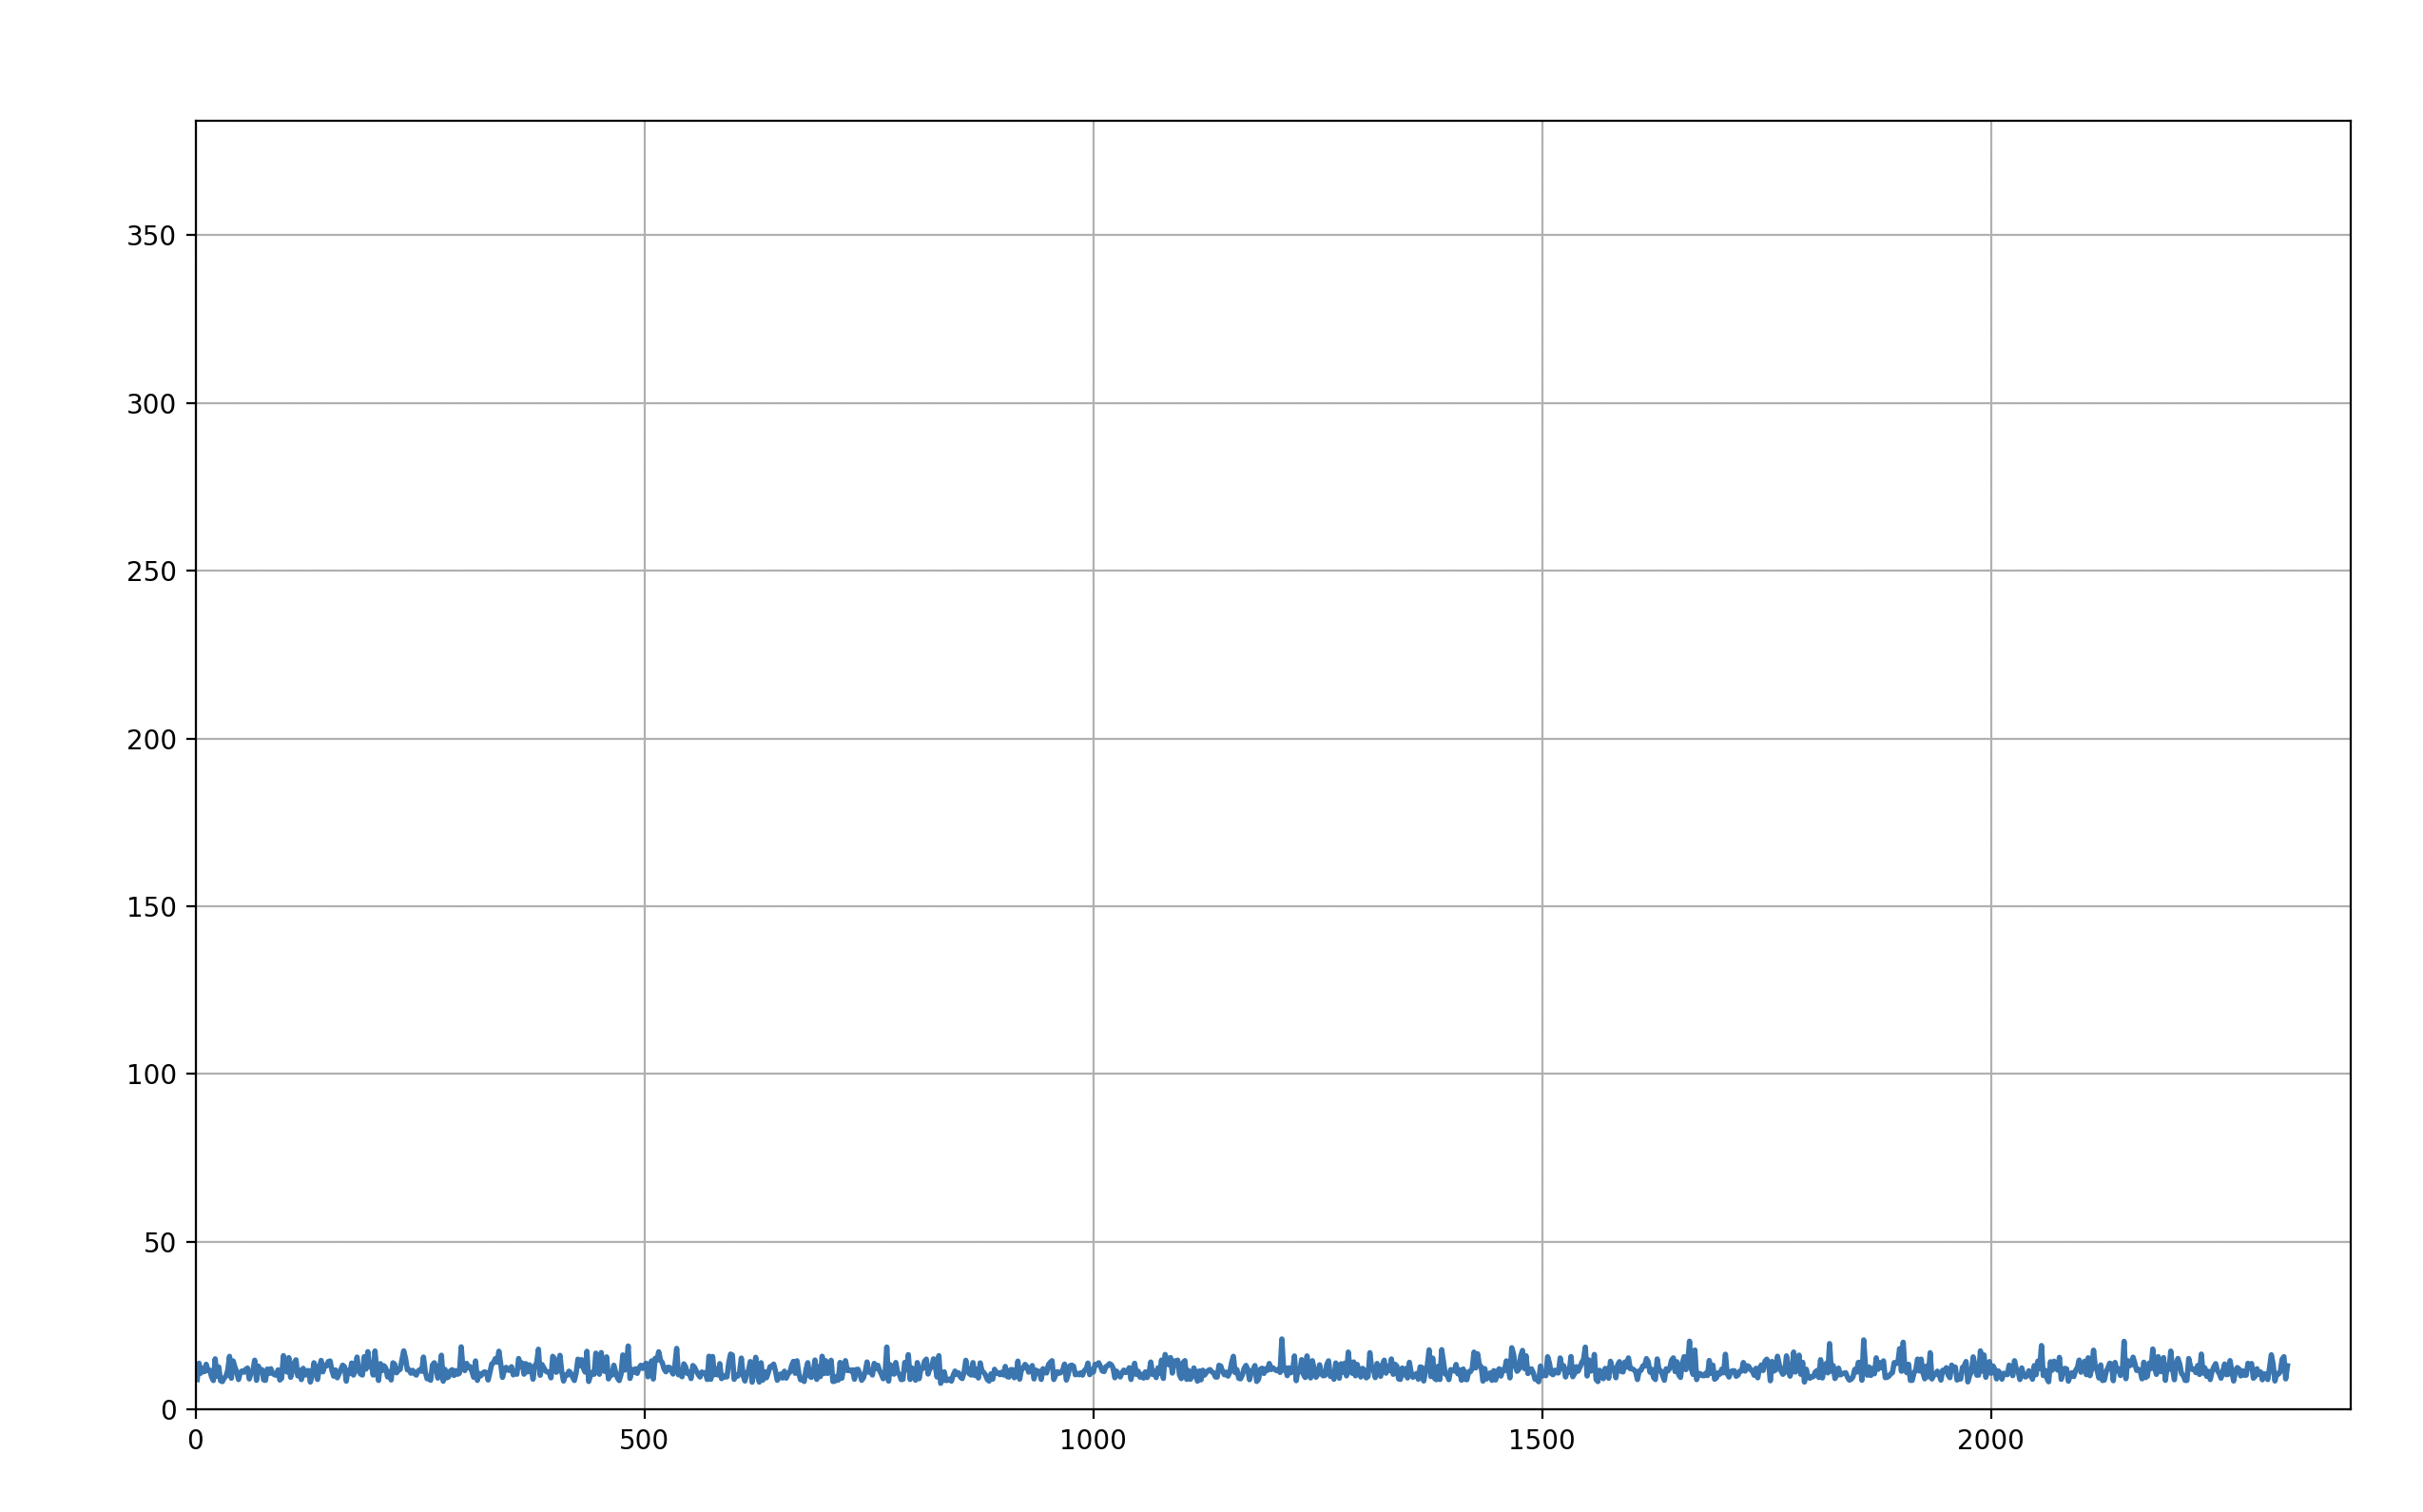
Here is how the latency graph looks like: